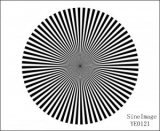
 | Camera Lenses Adjust Sector Star Test Chart (72 cycles)The YE0121 test chart is designed for the adjustment of camera lenses and checking back focal distance. It shows a 72 sector Siemens star on a white background.
|
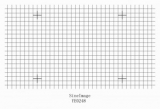 | 16:9 SineImage YE0248 Distortion Grid Test ChartThe YE0248 is designed to measure disortion of digital cameras. It contains a fine grid of black lines on white background.
|
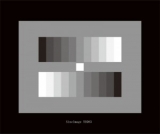 | Halftone Reproduction ITE Grayscale Chart I(Gamma = 0.45)The YE083 is designed for the evaluation of the halftone reproduction of an electronic camera. Two 11-graduated counter current gray scales are arranged on a gray background(D=0.62) .
|
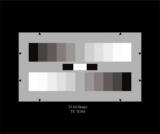 | YE165 11-Steps Gray Scale Test Chart welcome OEMThe YE 0165 is designed for evaluation the halftone reproduction of 16:9 electronic cameras. Two 11-graduated counter current gray scales are arranged on a gray background (D ≈ 0.56), the gray scale corresponds to the ITU recommendation BT
|
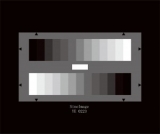 | Made in China Cheap HDTV Gray Scale Test ChartThe YE 0223 is designed for evaluation of the halftone reproduction of electronic cameras. Two 13-graduated counter current gray scales are arranged on a gray background (D = 0.75).
|
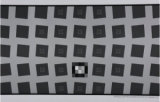 | SFRplus Large LVT Film ChartThis transmissive (backlit) SFRplus test chart can be used with the Imatest SFRplus module to measure MTF, lateral chromatic aberration, distortion, and tonal response.
|
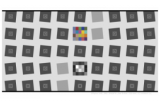 | Transparent SFRplus Chart: Inkjet on Paper - 10:1 & 2:1 Contrast RatioThe SFRplus test chart can be used with the SFRplus module in Imatest 3.2 or later to measure MTF, lateral chromatic aberration, distortion, tonal response, and color accuracy.
|
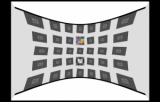 | Original Manufacturer of Automotive Test Chart Pre-distortion ChartThis chart is designed for testing automative cameras or other significantly distorted cameras. This large chart is designed to be reflectively lit, and captured at a an optimal focus distance.
|
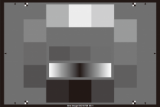 | Reflective/Transparent 16:9 ISO-15739 digital camera noise test chartThis 15-patch grayscale step chart has 12 of the patches in a somewhat elliptical arrangement on the periphery and three in an inside row. The relatively large patches are especially good for measuring noise.
|
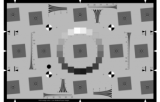 | Edge SFR test chart ISO 12233: 2014 (eSFR)Photographic chartISO 12233:2014 E-SFR charts are implementations of the Low Contrast Edge SFR (E-SFR) test chart illustrated in Section 6.1 and Annex C of the ISO Standard Document. We offer the Enhanced version of this chart in high resolution photographic
|
 | Camera opto-electronic-conversion-function OECF Test Chart (ISO 14524)The YE0197 is designed for evaluating the opto-electronic-conversion-function of a camera. The chart consists of a circular ordered 12-step-gray scale on a gray background.
|
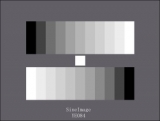 | Camera Halftone Reproduction ITE Grayscale Chart II(Gamma = 1)The YE084 is designed for the evaluation of the halftone reproduction of an electronic camera. Two 11-graduated counter current gray scales are arranged on a gray background (D≈0.65),
|
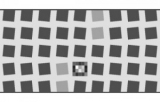 | QI-SFR10-P-RM SFRplus Chart on Photographic PaperThe SFRplus test chart can be used with the SFRplus module in Imatest 3.2 or later to measure MTF, lateral chromatic aberration, distortion, and tonal response. The SFRplus module features fully automated region-of-interest detection.
|
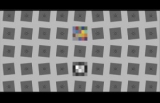 | Inkjet on Paper 4:1 Contrast Ratio Transparent Standard SFRplus ChartThe SFRplus test chart can be used with the SFRplus module in Imatest 3.2 or later to measure MTF, lateral chromatic aberration, distortion, tonal response, and color accuracy.
|
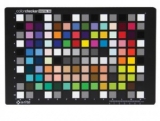 | Sine Image Manufacturer of Digital Color Checker SG Color Card Test ChartDigital ColorChecker® SG test chart test target includes the highest quality color reference standards available, andis used for Color Rendition.
|
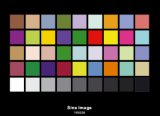 | Professional DTV Color Rendition Test Chart Welcome OEMThe YE0226 is designed for the evaluation of the color rendition of HDTV cameras. The chart consists of 36 color patches and a 9-step gray scale. In addition to the primary and secondary colors the test chart contains mainly the colors,
|
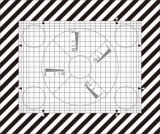 | TV Camera soperational Adjustment and Control Grid Test ChartNJ-10-100A is designed for operational adjustment and control of TV cameras. It consists of circles permitting rough visual appraisal of scan linearity, grid lines serving the purpose of adjusting registration and wedges serving the purpose
|
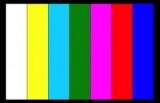 | TV Cameras Color Rendition of Color Bar Test ChartThe YE0106 is designed for checking the color rendition of TV cameras. The picture area is divided into six color bars showing the three primary colors red, green and blue and the secondary colors cyan, yellow and purple.
|
About Us Contact Us Focus on Color Global Agents Site Map
Link:colorimeter Color Assessment Cabinets pecolor iQstest spectrophotometer
© 1998~2024 ColorController, Incorporated. All Rights Reserved.