 |

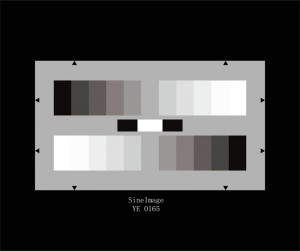
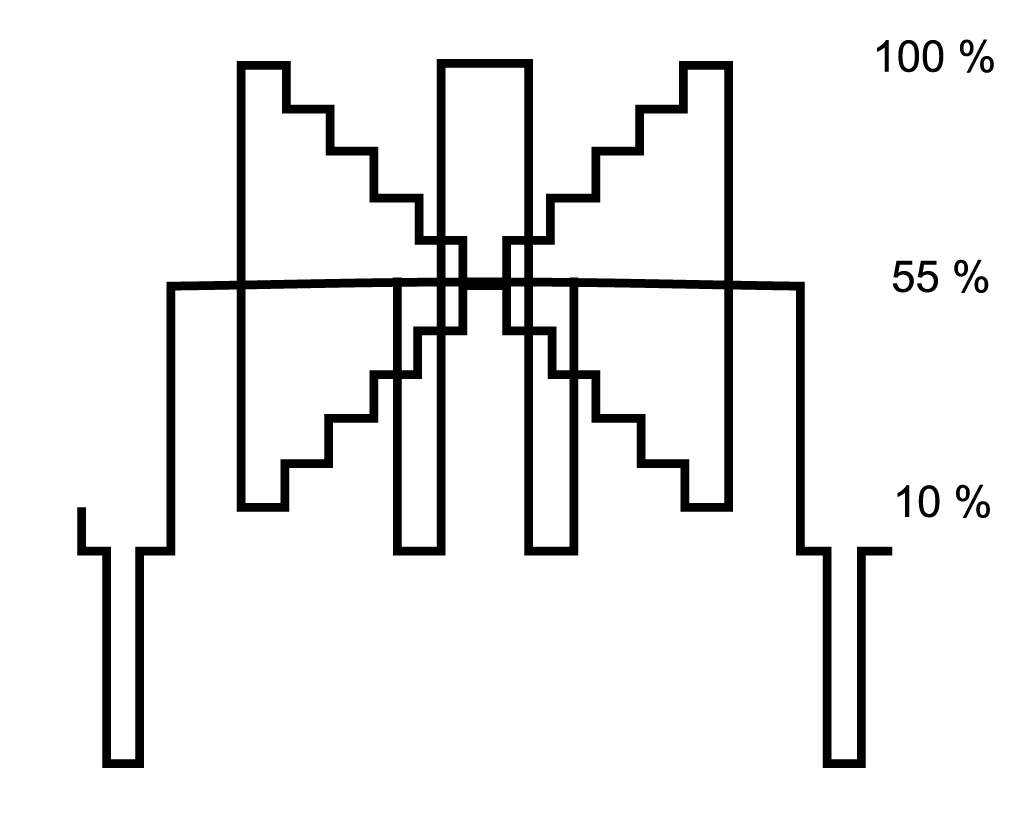
The output signal of an optimally gamma-corrected camera according to BT.709 generates two counter current, linear step signals.
The contrast range of the gray scale is 40 : 1.
The values of the 11-graduated gray scale are as follows:
| Step | Density | Remission in % | Video signal for BT.709 in % | Video signal for gamma 0.45 in % |
| 1 | 0.05 | 89 | 100 | 100 |
| 2 | 0.13 | 74 | 91 | 92 |
| 3 | 0.22 | 60 | 82 | 84 |
| 4 | 0.32 | 48 | 73 | 75 |
| 5 | 0.43 | 37 | 64 | 67 |
| 6 | 0.56 | 28 | 55 | 59 |
| 7 | 0.70 | 20 | 46 | 51 |
| 8 | 0.88 | 13 | 37 | 43 |
| 9 | 1.08 | 8 | 28 | 35 |
| 10 | 1.34 | 5 | 19 | 26 |
| 11 | 1.64* | 2 | 11 | 19 |
*The production process for reflective charts allow a maximum printed density of 1.64. The target value for the darkest step is 1.70. Therefore the distance of the last step differ slightly.
Adjust the aperture until the lightest patch reaches 100% video signal at the waveform monitor. With an optimally corrected camera according to ITU recommendation BT.709 the darkest patch will reach 10% signal level.

When using this chart with a gamma correction of 0.45 the video signal level for each step will change as listed in the table above.
About Us Contact Us Focus on Color Global Agents Site Map
Link:colorimeter Color Assessment Cabinets pecolor iQstest spectrophotometer
© 1998~2025 ColorController, Incorporated. All Rights Reserved.